“I think you can ask anyone, like, what can we improve? And you’ll always have at least one thing that they’ll suggest.”
June 2021
In this session of Sharing PIE, Ben Power, MS, CPHQ, from Barrett Hospital & HealthCare in Dillon, Montana, and ArvaDell Sharp, RN, from Pembina County Memorial Hospital in Cavalier, North Dakota, talk about data and how they approach using different sources of data in their small critical access hospitals.
Want to take Quality Time with you on the go? You can subscribe to the podcast version through your favorite streaming service.
Insights from your QI Mentors
 |
Ben Power, MS, CPHQ |
 |
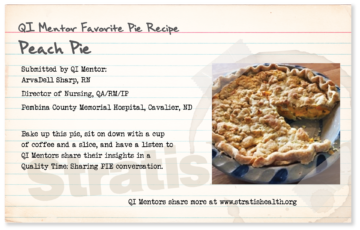
ArvaDell Sharp, RN Director of Nursing, QA/RM/IP Pembina County Memorial Hospital, Cavalier, ND Check out my favorite pie recipe below! |

Second helping of PIE?
If you would like more information
from the national virtual Quality
Improvement Mentors on their
performance improvement
experience in critical access
hospitals, please submit this
short form.
| QI Mentor favorite featured pie recipe: Peach Pie |
 |
Transcript: Using “Small Data” to Drive Big Improvements
Note: Quality Time: Sharing PIE is produced for the ear and designed to be heard. This transcript is intended to augment the recording.
Narrator: In this episode of Quality Time: Sharing PIE, we sat down with ArvaDell Sharp from Pembina County Memorial Hospital in Cavalier, North Dakota, and Ben Power from Barrett Hospital and Healthcare in Dillon, Montana, to talk about data and how they approach using data in their small critical access hospitals. To start, we wanted to get on the same page about what data is.
ArvaDell: I think that hearing the word data can be kind of scary to people, but it doesn’t have to be. If you think of how it can be measurable and how it can be a comparison with numbers, and what you’re comparing is how you can collect your data.
Ben: It’s really easy to think of data, you know, where we are right now in technological age, generating so much data, it’s easy to think of it in terms of big data and big predictive algorithms and such. But realistically, that’s not what we use data for in quality improvement, for the most part. There are a few exceptions, but generally speaking, you know, data’s coming from electronic health records, it’s coming from even some paper charts still occasionally. A lot of it comes from just talking with staff, asking them how things are going for them asking them about the needs of the patients that we have.
Ben: So there’s huddle data that comes into that. They’ll say, “We know that this is an issue because we had this problem,” which, that’s data.
Patient satisfaction scores are data, employee satisfaction scores are data. There are even some really good data in secondary sources that you may get like from a university, or from state and federal level, kind of telling you about your community’s needs. I think in some ways from a scientific standpoint, we want to discard small data, but in reality, I think that doing quality improvement in a small hospital is very much about the small data. It’s very much about understanding, as close to the work as possible, what’s actually happening.
Ben: Data is there to inform and measure quality improvement. And that’s, that’s really the point of it. It doesn’t… it’s not an end in and of itself.
ArvaDell: Right. And I see that when visiting with staff, that’s what I want them to see as measurable. And I think they have a kind of a hard time doing that, but that would be easy, to find something that they’re looking at now, and they just need a measurable figure to relate to.
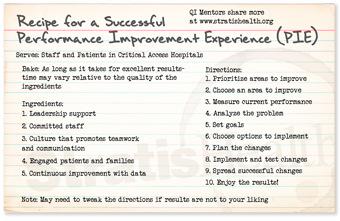
ArvaDell: If you look on the PIE recipe, on the directions, I mean, just go down the list of your directions. You know you want to prioritize your area to improve and choose an area to improve. That’s usually pretty easy. The next part is, like, how do you do it? You know, what do we need to do next?
Ben: Yeah, you get that surface piece of data that says, “Here’s the problem,” and then you can dive in and, and gather more data.
Narrator: The mentors shared some examples of how their teams have used different kinds of data to inform quality improvement initiatives.
ArvaDell: I know one of the studies that we have done, we’re a designated level four trauma center in a stroke-ready facility. And to be designated, we are required to be in compliance with criteria for optimal patient outcomes. The coordinators for both of these programs in our facility have worked very hard educating the staff on meeting these criteria, but it seemed like when they would track the charts audits, they would see that we were below the threshold on some of the areas, and it looked like the documentation needed improving. And so, in those types of settings, you know, the ER is kind of crazy the way it is. And so, they kind of figured on developing a cheat sheet for the nurses to go through on these patients. So, in nursing school, I learned that if it wasn’t charted, it wasn’t done. So, with the input they had from the frontline nursing staff, they use these cheat sheets, which were implemented as reminders. And now the nurses use those cheat sheets on these stroke codes or the trauma codes. And that has really helped compliance in our documentation, and hence, meeting our designation criteria and, hopefully, better patient outcomes.
Ben: Yeah, absolutely. That’s a great point.
Ben: Getting the right information to the right people is so much the part of data because healthcare works so much on the flow of information. And it’s just making sure that that information for improvement gets to the right people.
Ben: That’s a really cool project. Something that we did was working on insulin-related hypoglycemia, so one of the things that we took a swing at was looking at some raw data from barcode medication scanning. And what was interesting about this data is that it’s just a bunch of raw information. And in the absence of having any sort of predefined reports based on it, I just dug in and worked on developing reports based off of it. One of the barcode scanning reports was the top 10 or bottom 10, however, you want to think of it, least scanned drugs at 15 or more administrations. So, we were able to look at, what’s not getting scanned, but is still being used. And one of the drugs that came up as we were specifically looking for, like, high-alert medications and such, Lispro came up. So, being kind of concerned to see diabetic medication on there, we took a quick walk.
So this is kind of my practice, would be to first, you know, use the data to sort of give the landscape and identify the problem, which is, is sort of in that prioritize areas to improve and choose areas to improve. You’re looking at that. And, and it was very easy to measure the current performance because the drug hadn’t been scanned at all that month. And so, it was really easy to have that baseline, but that’s where you go out and you start getting your additional data because that’s not enough information to make a decision on.
Ben: Well, I got very lucky (laughs) in this case ’cause I went over to the medication room and the pharmacy tech was in there stocking the Pyxis. So, um, after she was done, we had a chat about how that might’ve happened from a process standpoint. And it turns out, of course, that those vials don’t go into the room, which makes a lot of sense. However, they should be stocking little sticky flags that you attach to the syringe, and that goes into the room with you.
ArvaDell: Right.
Ben: But for some reason, that was in place for all of the other vials in the Pyxis, but not for this one. So, it was a really easy analysis, and that somehow this got dropped. This medication had been added to the Pyxis at a different time and didn’t get flags attached to it. So, we implemented a quick system where we had a brightly colored card that has the name of the drug on it. And the nurses, if they pull enough of the flags out, they’ll get down to this and then they take it out, they put it on top of the Pyxis, and when the tech comes into stock, they take the card back and they know to restock that particular flag. So, we saw the scanning for that immediately jump. And sort of just to give a little bit of a broader context, this was part of our process of cutting over and making some changes for medication safety. One of the big ones was the barcoding, but in the context of that, over the next year, we saw a 50% drop in medication errors. And we saw a 100% drop in insulin-related hypoglycemia. That was over the course of a couple of years. It took us a while to get down to that. And we kept it down for about a year, we kept it down at zero.
ArvaDell: Mm-hmm. Good.
Ben: We had a goal; our goal was 95% scanning compliance. We implemented our changes, we tested the changes, and then once it was completed, we asked the question, “Are there any other medications this needs to be done for?” And that’s our spreading successful changes tests that we do for all of our projects. Is there anywhere else that this same fix needs to be applied? And so, so I thought it was a really good example of running through that. We have that issue fixed in like 30 minutes It was just that fast because when you have that culture you can move those projects along when you can identify the root cause that quickly.
ArvaDell: Well, and your goal is to improve. It’s not to penalize anybody for doing wrong or doing mistakes…
Ben: Exactly.
ArvaDell: It’s to improve patient safety and outcomes.
Ben: We had all the information we needed. We had enough data to know there was a problem. And then when we went to the place where the work was being done, we knew we had enough data to know exactly what the problem was. And, and we didn’t want any more data until we started remeasuring. We just had enough, (laughs) so-
Ben: …it was a good problem to have [crosstalk 00:20:19].
ArvaDell: Sometimes it gets too big and you don’t want to do that either. You don’t want to-
Ben: That’s a common mistake-
ArvaDell: … you don’t want a whole giant elephant. Yup. Just take a little piece of it.
Ben: I’ve made that mistake working with data quite a bit is giving people more than they asked for. It’s kind of like in lean where they say, you know, you should always give the customer only what they asked for. That’s, uh, very true with data.
Narrator: We were curious to hear more about the importance of sharing the right amount and type of data, considerations for analyzing data in the context of low volumes, and how to use data to inform the prioritization of QI efforts.
Ben: That is always a caveat that I try to make for people when they’re measuring… Can we just call it small data (laughs) um, instead of big data? When they’re using small data for improvement is just to be aware that if your results look too good to be true or too bad to be true, they might actually be. Um, you know, you have to look at what your denominator is that you’re measuring and just be- just use some, some real data common sense. If you only measure five patients, the chances of you having an 80% rate are pretty good. And if you set a 95% compliance rate, the only way to make it is to get 100%. So, so there’s just a lot of thinking about it you have to do when you go into that and designing that.
ArvaDell: So in this case, we don’t… in this case, you don’t take just that one set. You know, maybe check next time, and next time maybe-
Ben: Right.
ArvaDell: … you know, totally good. And then the next time is totally good. And it’s like, okay. And then the next time you’re down again. You know, you’re gonna may have some of those peaks and lows every once in a while with some of that.
Ben: Yeah, exactly. And, and when you see a blip, just think back, “Well, what have I had in the last 12 months with this? You know, is this, is this an ongoing issue?
ArvaDell: Yeah. Is it high risk, is it high volume?
Ben: Mm-hmm (affirmative).
ArvaDell: You know, those types of areas.
Ben: We call it frequency and blast radius. So how often does it happen, and how bad is it when it does happen? Um, and if they’re both high, you better deal with it. (laughs)
ArvaDell: I like that.
Ben: Transparency and visibility aren’t the same things. You can be super transparent with your data and give people so much data, they will never read any of it. And I feel like, with visibility, you can be really visible, like hang stuff over the front door and not actually be transparent. You can give people misleading data. So to be both transparent and visible, so visibility, meaning to have the right data in the right place, and then transparency meaning to have data that really tells people the truth about your projects and your practice.
Ben: It is really easy to flood people with data. And I think sometimes folks do it when they are trying to hide something. (laughing)
Narrator: The mentors each shared another example of ways their teams have used data to inform QI projects.
ArvaDell: A study that we did to justify a new program that we started in our facility was that four years ago, our physical therapy department sponsored a 12-week athletic enhancement program for middle and high school students. And so, they kind of had to prove themselves that this was needed and, you know, to go on for the next year.
So after the first year, they collected data to see, like, if the students demonstrated increased strength in limited areas, if they improved their agility score, and if they could improve their single leg vertical jump score. That’s kind of all physical therapy terms in how they were collecting their data. They kind of set their threshold ’cause they wanted to see that 90% of those participating in this program would show an increase in these areas. So, the first year, they had 21 students participate. They compared the pre and post numbers of those areas. And their evaluation was that 94% of the participants increased their scores. So they felt good that this data was used to justify the importance of continuing this service, not only for administration and the governing board to approve continuing this program, but it kind of justified the school, and the students, and those participating, that this program was beneficial.
Ben: So we had a great project that one of our physical therapists did and it was just such a great use of data. She went through a lengthy period of time, and looked at the schedule and identified all of the 15-minute and 30-minute breaks between appointments for a month, and teased out if they rearranged their schedule so that those breaks didn’t exist, what would that do to enhance scheduling and enhance revenue for the year?
And if we extrapolate those numbers over the course of the year it was over $40,000 in revenue difference, and not to mention, again, when you speak of costs, you’ve got to remember the other quality issues come along with that. For instance, patient access, which means you can get more patients in a day. So those patients might be able to not have to wait as long to be seen. So, so I think there are some patient benefits to that, besides just us being able to offer great services.
ArvaDell: So you’ve got patient satisfaction.
Ben: Yeah.
ArvaDell: Right.
Narrator: To wrap things up the mentors shared some key takeaways related to data and quality improvement.
Ben: Data is that sort of nebulous word that we associate with technology and we associate, oftentimes with lots of math and confusion, but in reality, it’s just making sure that we have our facts straight about the problem.
ArvaDell: I think you can ask anyone, like, what can we improve? And you’ll always have at least one thing that they’ll suggest.
Ben: Mm-hmm.
Narrator: Quality Time: Sharing PIE was produced by Stratis Health, with funding through Rural Quality Improvement Technical Assistance — a program supported by the Federal Office of Rural Health Policy — to help critical access hospitals across the country move from quality reporting to quality improvement. Want another serving of PIE? Or have a burning question about rural quality improvement? Visit the QI mentors web page.